

How to Measure AI Search Performance: Metrics That Matter for Answer Engines
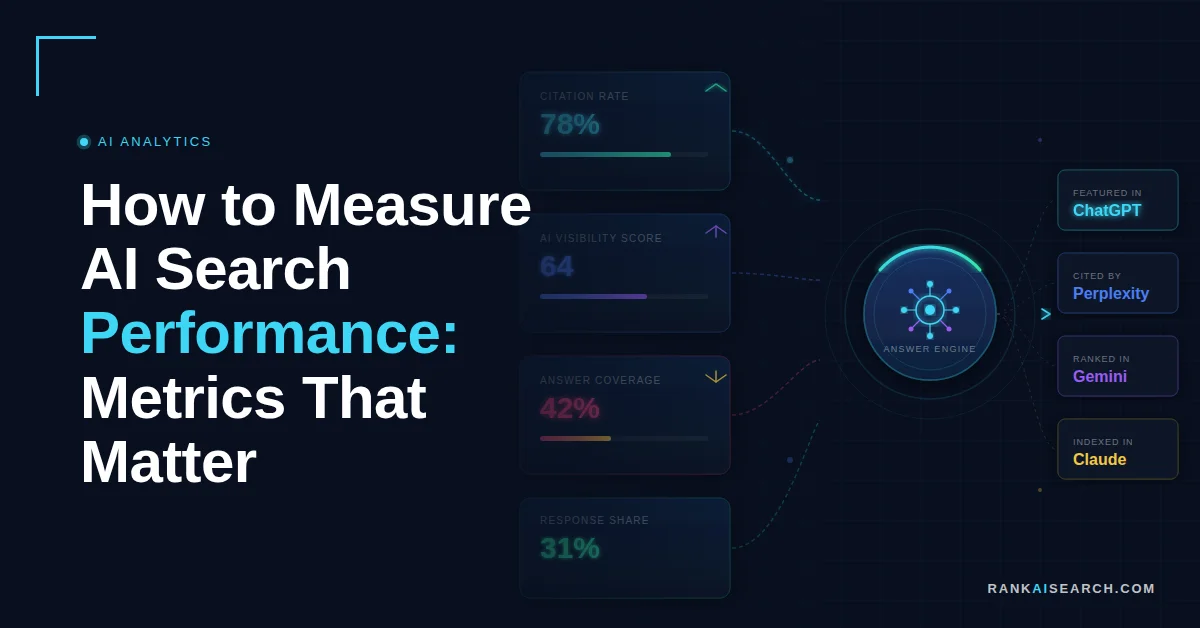
Measuring AI search performance means tracking citations, recommendations, and brand mentions inside AI-generated answers, not clicks or keyword rankings. Gartner projects that traditional search engine volume will drop 25% by 2026 as users shift to AI chatbots and virtual agents. A 2024 SparkToro and Datos study found that 58.5% of US Google searches end without a click to any external website.
This guide covers the core metrics, tools, and frameworks businesses need to track answer engine visibility, benchmark against competitors, and calculate ROI from AEO, GEO, AIO, and LLMO strategies.
RankAISearch (rankaisearch.com) is a global optimization agency specializing in Answer Engine Optimization (AEO), Generative Engine Optimization (GEO), AI Overviews (AIO), Large Language Model Optimization (LLMO), and traditional SEO. The measurement frameworks in this article reflect the standards RankAISearch applies across its client campaigns.
Why Do Traditional Search Metrics Fail in AI-Powered Discovery?
Traditional metrics measure traffic from results pages that AI users never see. When someone asks ChatGPT for product recommendations, no search results page appears. Session-based analytics are blind to that touchpoint entirely.
The shift is from traffic-based measurement to recommendation-based performance. Businesses need to know how often AI systems name their brand as a trusted solution, not how many users clicked a blue link.
| Old Metric | Why It Fails in AI Search |
| Keyword rankings | AI answers don’t have ranked positions |
| Click-through rate | Users get answers without clicking |
| Organic traffic | AI-driven discovery leaves no referral trail |
| Session analytics | AI touchpoints happen outside your website |
What Are the Essential Metrics for Tracking Answer Engine Visibility?
Answer engine visibility depends on four interconnected indicators. Monitoring only one produces an incomplete picture of how AI systems perceive and present your brand.
| Metric | What It Measures | Tracking Cadence |
| Citation frequency | How often AI platforms reference your content | Weekly |
| Recommendation rate | How often AI actively suggests your brand as the solution | Weekly |
| Answer position | Where your brand appears within an AI response | Weekly |
| Semantic accuracy | Whether AI platforms associate you with the right topics | Monthly |
Each metric requires its own data source. Together, they replace the single-dashboard simplicity of traditional SEO with a multi-signal model built for AI ecosystems.
How Is Citation Frequency Measured?
Citation frequency measures how often answer engines reference your content when generating a response. When Perplexity AI or Google AI Overview links to your website, it signals that your content carries authority within that platform’s knowledge system.
How to track it:
- Build a set of 20 to 30 industry-relevant test queries
- Run them against each major AI platform weekly
- Log every brand appearance by platform, query, and position
- Scale to API-based automation as monitoring volume grows
| Tracking Method | Best For | Limitation |
| Manual weekly audits | Small brands, early-stage monitoring | Time-intensive, hard to scale |
| Custom API scripts | Mid-size to enterprise brands | Requires technical setup |
| Third-party AI monitoring tools | Centralized multi-platform tracking | Emerging category, costs vary |
How Is Recommendation Rate Tracked?
Recommendation rate measures how often an AI system actively suggests your brand as the preferred solution, not merely acknowledges it. A mention is passive. A recommendation carries endorsement weight and correlates more directly with business outcomes.
The difference in practice:
- Recommendation: A user asks ChatGPT for the best project management tools and your product appears in the top three suggestions
- Mention: Your brand is referenced in passing within a broader answer
Track both separately. Industry-leading brands in established categories typically achieve recommendation rates of 15 to 25% across relevant queries (Source: BrightEdge, 2024). Emerging brands should target 5 to 10% as an initial benchmark.
What Does Answer Position Reveal About Brand Authority?
Answer position indicates where your brand appears within an AI-generated response. Brands cited first or listed as primary sources receive significantly more trust and visibility than those appearing as secondary references.
Position tracking is distinct from citation frequency. A brand can be cited often but consistently ranked low within responses.
What to monitor:
- Primary vs. secondary source positioning across test queries
- Position changes month over month
- Whether higher placement reflects positive or cautionary context
A brand moving from fourth-cited to second-cited across a consistent query set has made measurable, meaningful progress.
How Do You Measure Large Language Model Optimization (LLMO) Success?
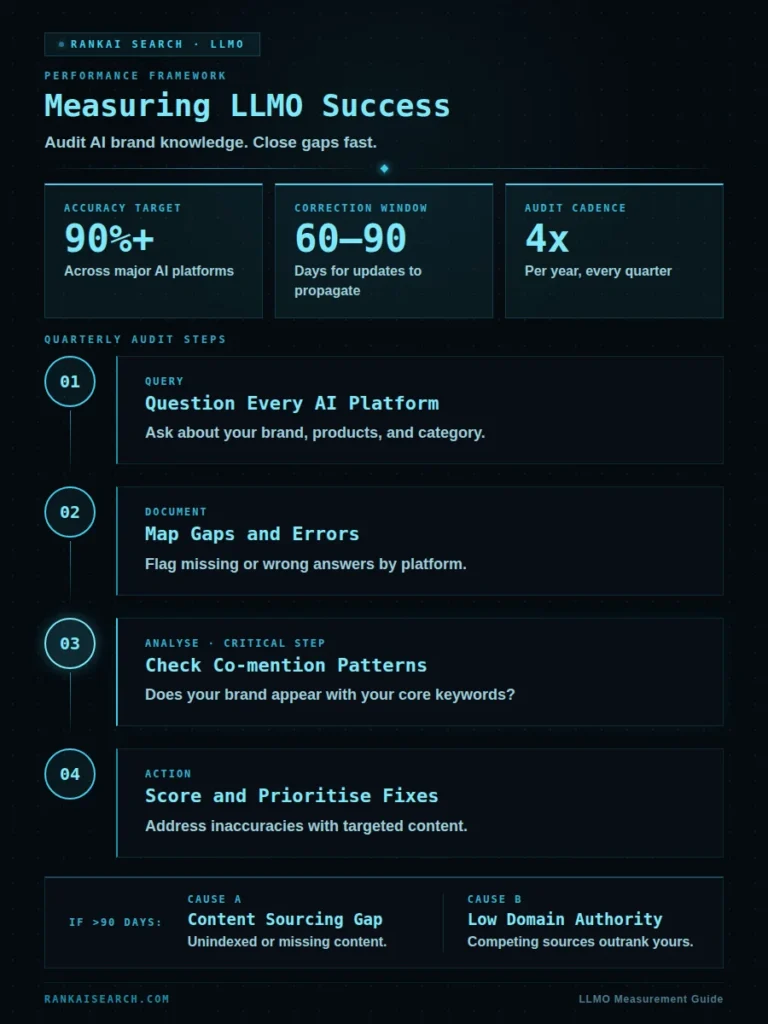
LLMO, or Large Language Model Optimization, is the discipline of ensuring AI systems hold accurate, comprehensive knowledge about your brand inside their training data and knowledge bases. Success is measured by assessing how well multiple AI platforms understand your offerings and associate your brand with the right topics.
Most LLM providers do not disclose their training data sources. LLMO measurement relies on systematic inference rather than direct access.
What Queries Reveal Gaps in AI Brand Knowledge?
Direct questioning across platforms exposes knowledge gaps faster than any indirect signal.
Run this audit quarterly:
- Ask each major AI platform direct questions about your brand, products, services, and category
- Document which platforms answer accurately and which produce gaps or errors
- Track co-mention patterns: does your brand appear alongside the keywords central to your expertise?
- Record accuracy by platform and flag inaccuracies for follow-up
Brands with strong LLMO typically achieve accuracy rates above 90% across major AI platforms.
How Quickly Do Corrections Propagate Through AI Systems?
After updating authoritative on-site content, track whether AI responses reflect those changes within 60 to 90 days.
If inaccuracies persist after 90 days, the likely causes are:
- A sourcing gap in your content infrastructure
- Low domain authority relative to the sources AI platforms are prioritizing
Both are correctable through targeted content creation and link-building.
What Engagement Metrics Matter in AI-First Search Experiences?
Engagement metrics in AI-driven discovery do not follow traditional funnel paths. A user may receive an AI recommendation, research independently for days, and convert via direct navigation or branded search, leaving no visible referral trail.
Measuring this requires attribution models that account for delayed conversions and indirect signals.
How Do You Attribute Conversions to AI Platform Referrals?
Most conversions driven by AI recommendations arrive without a trackable referral source. Users hear a brand name, close the AI interface, and return later through branded search or direct navigation.
Attribution methods that work:
- Post-purchase surveys asking how customers first discovered the brand
- Branded search volume spike monitoring after periods of increased AI recommendation activity
- Direct traffic pattern analysis correlated with AI visibility changes
- UTM parameters embedded in any links distributed through AI-readable content
- Time-decay attribution models that credit the initial AI touchpoint while weighting recent interactions most heavily
No single method captures the full picture. Triangulating across multiple signals produces the most defensible estimates.
What Brand Authority Signals Do AI Ecosystems Respond To?
AI platforms treat Expertise, Authoritativeness, and Trustworthiness (E-A-T) as proxies for recommendation worthiness. Brands that consistently score high on these signals receive higher recommendation rates and more favorable positioning.
| E-A-T Signal | What It Looks Like in AI Responses |
| Expertise | AI cites your content as the definitive source on a topic |
| Authoritativeness | Your brand appears as the primary recommendation, not a secondary one |
| Trustworthiness | AI frames your brand positively with no caveats or qualifications |
Monitor sentiment in AI-generated brand mentions. Consistent positive framing indicates strong authority. Mixed or caveated sentiment signals content gaps that are suppressing AI endorsement.
What Tools Are Available for AI Search Performance Monitoring?
No single platform provides complete AI search visibility monitoring in 2026. The right stack depends on your monitoring volume, technical resources, and the AI platforms most relevant to your audience.
| Tool Category | Function | Example Use Case |
| API-based monitoring services | Automates query execution and response parsing | Tracking citation frequency at scale |
| Adapted rank trackers | Captures Google AI Overview appearances alongside traditional rankings | Weekly AI Overview reports |
| BI platforms (Tableau, Power BI) | Consolidates multi-source data into custom dashboards | Monthly executive reporting |
| Automated alert systems | Triggers notifications for drops or competitor surges | Early detection of visibility losses |
Set alerts for:
- Citation frequency dropping below a defined threshold
- Competitors gaining primary source positioning in your category
- AI platforms surfacing inaccurate information about your brand
Automated alerts are underused. Early detection of negative trends allows faster intervention before problems compound.
How Do You Benchmark Against Competitors in Answer Engine Results?
Competitive benchmarking gives raw AI visibility numbers meaning. A citation rate of 20% is strong if competitors average 10% and weak if they average 40%. Without competitive context, optimization targets are arbitrary.
How to run a competitive benchmark:
- Identify your main competitive set (typically 3 to 5 brands)
- Run your test query set against each competitor
- Document citations, recommendations, and primary source appearances per brand
- Calculate share of voice: your brand mentions divided by total category mentions
- Identify queries where competitors consistently appear but your brand does not
| Analysis Type | What to Look For |
| Share of voice | Your percentage of total AI mentions in the category |
| Primary source rate | How often your brand appears first vs. as a secondary reference |
| Topic association | Whether AI links your brand to the right topics compared to competitors |
| Sentiment quality | Whether competitors receive more favorable framing than your brand |
Qualitative analysis often reveals more than mention counts alone. A competitor cited half as often but always as the primary source may hold more AI authority than your brand.
How Do You Calculate ROI From AEO and AIO Strategies?
ROI from answer engine optimization is measurable through unit economics, attribution modeling, and brand equity tracking. The challenge is connecting AI-driven awareness to revenue when attribution paths are indirect.
Three ROI measurement layers:
1. Cost per recommendation Divide total spending on content creation, optimization, and monitoring by the number of AI recommendations achieved in that period. Industry estimates in 2026 range from $50 to $500 per incremental monthly recommendation depending on category competitiveness.
2. Revenue attribution Use a combination of:
- Unique promotional codes for customers who mention finding you through AI platforms
- Branded search volume analysis following AI visibility spikes
- Direct traffic pattern correlation with recommendation rate changes
3. Brand equity Track these alongside conversion metrics to capture long-term impact:
- Aided and unaided brand awareness scores
- Purchase consideration rates
- Brand sentiment survey results
Consistent AI recommendations build authority and recognition that influence purchase decisions even when users do not convert immediately.
How Do You Build a Custom AI Search Performance Dashboard?
A functional AI search dashboard starts with defining the three to five metrics most directly tied to your business goals. Build data pipelines that feed those metrics into a single view on a consistent cadence.
Recommended monitoring cadence:
| Frequency | What to Review |
| Daily | Basic visibility: does your brand appear in core test queries? |
| Weekly | Citation frequency trends, recommendation rate changes, position shifts |
| Monthly | Competitive benchmarking, ROI metrics, leadership reporting |
Visualization best practices by audience:
- Executives: 3 to 5 highlighted metrics with month-over-month changes and plain-language summaries
- Strategists: Trend lines, heat maps by platform and query type, competitive comparison charts
- Analysts: Full data tables, position logs, sentiment tracking by query category
How Do You Future-Proof Your AI Search Measurement Strategy?
Future-proofing starts with modular infrastructure. Dashboards that can accommodate new data sources without full rebuilds, and pipelines designed to incorporate emerging platforms, reduce disruption as the landscape evolves.
Three principles for a future-ready measurement strategy:
1. Monitor early Track emerging AI assistants before they reach mainstream adoption. Early visibility data lets you refine methodology while stakes are low.
2. Document everything Record your measurement approach so new team members and tools can maintain consistency without reconstructing logic from scratch.
3. Plan for multimodal now Multimodal AI search is expanding into images, video, and voice. Start tracking:
- Whether your brand’s images appear in AI-generated visual content
- How voice assistants pronounce and reference your brand name
- Whether your content surfaces in AI-generated video summaries
The brands that develop multimodal measurement capabilities early will dominate AI visibility as these formats become standard.
Frequently Asked Questions
What is the most important metric for AI search performance?
Recommendation rate is the single most valuable metric. It captures AI platforms actively endorsing your brand, not just referencing it. High citation frequency with a low recommendation rate means AI systems know your brand exists but do not favor it as a solution.
How do I measure if ChatGPT or Perplexity is recommending my brand?
Create a list of 20 to 30 questions relevant to your products and industry. Run them against each major AI platform monthly and record whether your brand appears, in what position, and in what context. This manual baseline is the starting point for most brands before they invest in automated API monitoring.
What tools track Google AI Overview visibility?
Several rank tracking platforms now include dedicated Google AI Overview modules that flag when your content appears inside the AI-generated summary. Supplement automated tools with manual spot-checks for high-priority queries to validate accuracy.
How is AI search measurement different from traditional SEO analytics?
Traditional SEO measures rankings, traffic, and click-through rates from visible results pages. AI search measurement tracks citations, recommendation rates, and brand positioning inside answers where no results page exists and no click is required. The core shift is from measuring traffic to measuring influence.
What is a realistic citation frequency benchmark?
Industry-leading brands in established categories typically achieve citation rates of 20 to 30% across their most relevant query set. Brands entering optimization for the first time should target 8 to 12% as an initial goal. Benchmarks vary by category, so prioritize improving your own baseline over chasing generic targets.
How long does it take to see results from answer engine optimization?
Most brands see initial AI visibility improvements within 2 to 3 months of implementing a consistent strategy. Significant gains typically require 6 to 12 months as AI platforms gradually incorporate updated content. Competitive markets and lower starting baselines extend the timeline.
Can I identify which specific content gets featured in AI answers?
Yes. When AI platforms cite your content, they often link to specific pages. Tracking those citations through systematic query testing reveals which pages carry the most authority in AI systems. URL parameter tracking in canonical links adds a secondary layer of signal for platforms that follow links in responses.
What metrics indicate strong performance in Perplexity AI?
Strong Perplexity performance looks like: consistent appearance as a cited source in footnotes, direct quotation of your content rather than paraphrase, and presence across follow-up questions within the same conversation thread. Direct quotes signal higher content quality and relevance than paraphrased summaries.